
Image
Source
Adams, James. 2018. “Created Image: Cascading California.” In Toxic Correspondence, created by James Adams. In Visualizing Toxic Subjects Digital Exhibit, curated by James Adams and Kim Fortun. The Center for Ethnography. March. http://www.centerforethnography.org/content/created-image-cascading-california
Language
English
Contributor(s)
Group Audience
English
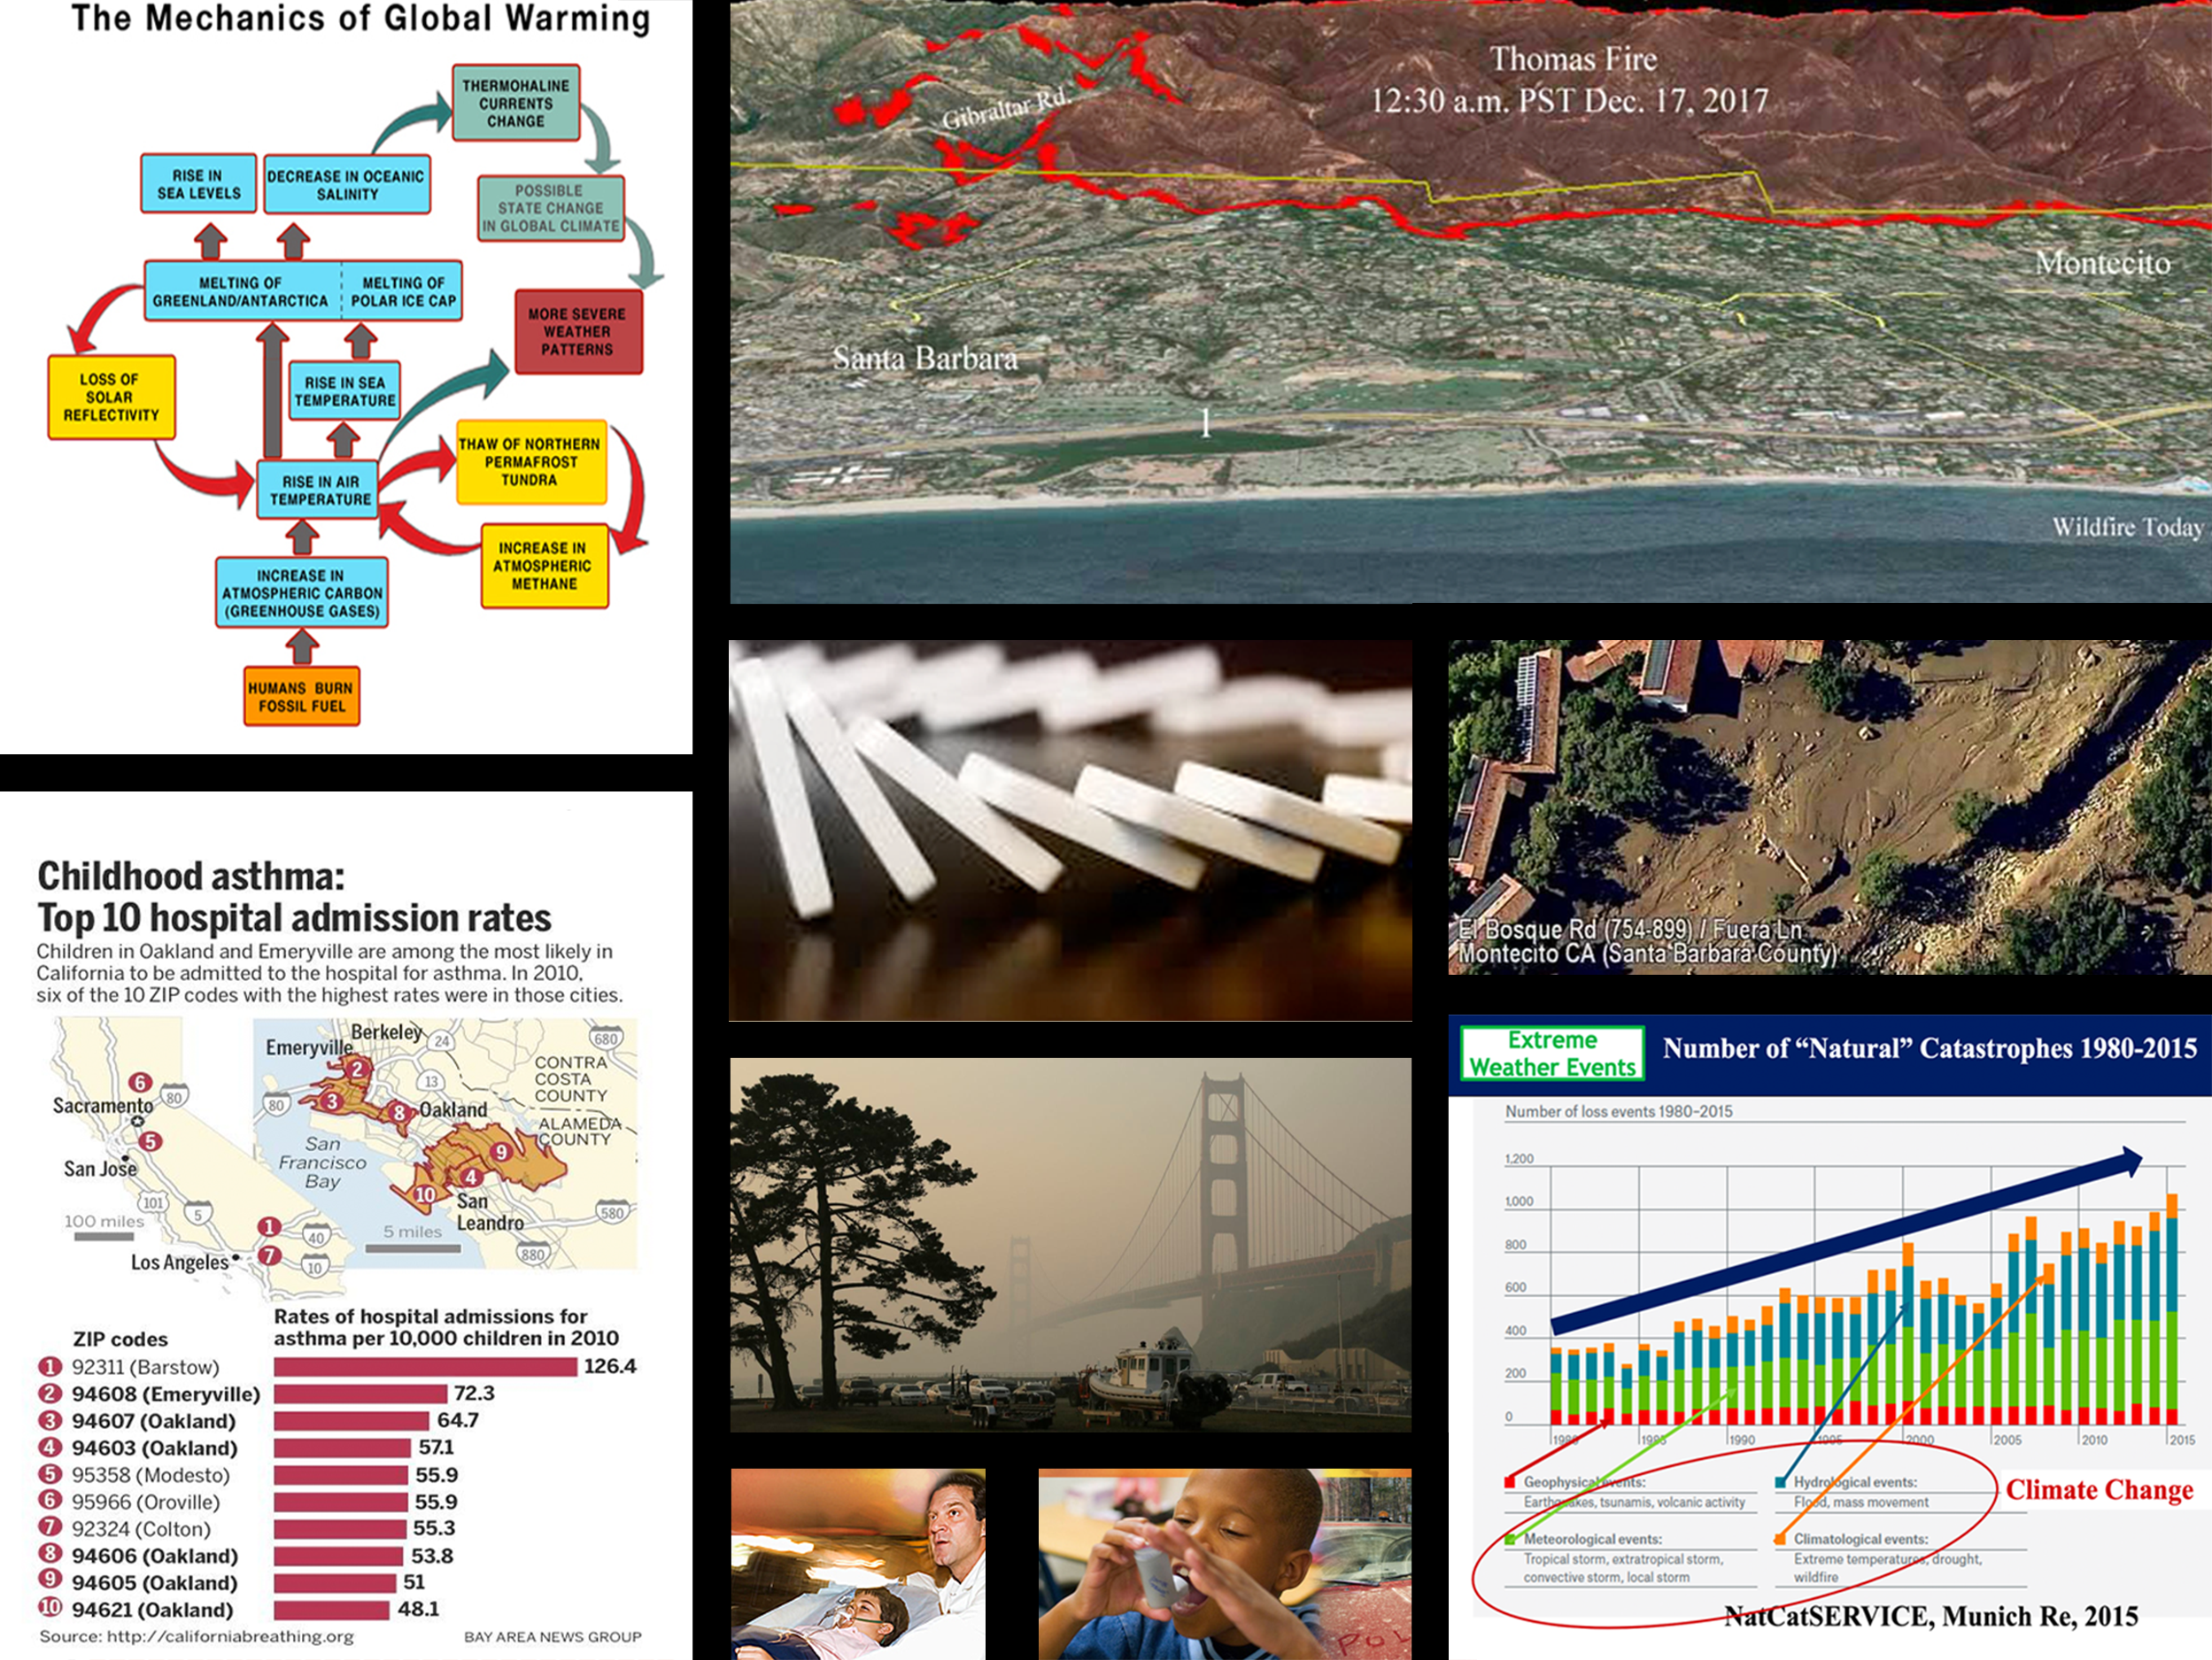
Substantive Caption: This image illustrates how climate change is problematizing our lingering assumptions of environmental stability. It calls for a radical reformulation of our extant habits of thinking, researching, and living with the runaway climate systems and failing infrastructures of our present. This is accomplished through a sequence of visually rendered conceptual models, historical events, data patterns, and statistics that themselves loop around a central visual metaphor: toppling dominoes.
The mental image of toppling dominoes is a popular way of conceptualizing the idea of a “cascading disaster” (AghaKouchak et al. 2018), or a sequential chain of adverse events. In this case, the first moment in the cascade is represented by a conceptual model of the feedback loops that contribute to higher temperatures and extreme weather (including drought). This combination of heat and drought sets the conditions for grander and more numerous forest fires, such as the Thomas Fire of December 2017 that ravaged the mountains above Montecito. Below this digital rendering of the fire zone we find a photograph of the third moment in this cascade. Less than a month after the fire, heavy rainfall upon this charred and desolate mountain range resulted in a deadly mudslide that killed 21 residents of Montecito and injured 160 others. Finally, the corner image—a data visualization of annual rates of "natural catastrophes"—extrapolates from the former three to show how these cascading effects have culminated in a general trend towards higher numbers and varieties of climate related disasters.
The next series of images begins with a photo of disaster cascading from the 2018 Campfire in northern California. Here we see the iconic Golden Gate Bridge surrounded in a cloud of smog—a mixture of smoke and fog—that had drifted southward into the Bay Area. With the addition of heat, these high concentrations of carbon dioxide and water vapor, already harmful in themselves, exacerbate the toxicity of the air through the intensification of the production of ozone (Jacobson 2008). The final image of the sequence shows a ranking of California cities according to asthma-related childhood admissions to hospitals, establishing that those most likely to bear the brunt of the state's climate-induced epidemics of air quality are disproportionately represented by poor communities and people of color, inculpating the state's long-running history of classist and racist spatial poltics.
Much like looking at a line of dominoes that have collapsed and are now overlaid upon one another, the previously described chain of connection between these events (rising temperatures, extended droughts, massive conflagrations, deadly mudslides, increased air pollution, and disproportionately high rates of asthma amongst vulnerable populations) is not unintuitive or surprising in hindsight. But the analytical purchase of this image isn't simply in identifying the causal connections or temporal sequence of these events. Rather, this image is also an attempt to communicate our current inability to recognize how the dominoes have been/are still being stacked to enable these moments of cascade. In this sense, this image could be considered pre-ethnographic, in that it warrants the utilization of the unpredictability of fieldwork to help us invent a new affective attunement, new research practices, and eventually a new way of living in an environment that is in a state of violent instability and indeterminacy.
Design Statement:
"Cascading California" is a collage of found images that are arranged in such a way as to:
With this collage, I am attempting to follow Hamdy et al.'s (2017) lead and combine layers of visual-semiotic signs to articulate a concept and construct a visual argument. I have also tried to incorporate Steven Davis' design principle of information density--as developed in his Visualization Across Disciplines Seminar (2018)--but without sacrificing an ethnographic feel. For example, the arrangement of the images is purposeful. The toppling dominoes is located dead center, as it serves as the primary metaphor of "cascading disaster." Next, the outer ring of sequenced events circles around this center image in a way that is iconic of a feedback loop. Lastly, the direction and path of the dominoes is iconic of the direction in which the whole image is intended to be "read." These visual clues notwithstanding, I would not assume that my viewer would be able to ascertain all of this information by simply looking at the image. The pairing of the visual with verbal explanation is still vital to the argument's success.
On a more aesthetic level, the design of the image is intended to be reminiscent of the work of Piet Mondrian.
References:
AghaKouchak, Amir, Laurie S. Huning, Felicia Chiang, Mojtaba Sadegh, Farshid Vahedifard, Omid Mazdiyasni, Hamed Moftakhari, and Iman Mallakpour. 2018. “How Do Natural Hazards Cascade to Cause Disasters?” Nature 561 (7724): 458. https://doi.org/10.1038/d41586-018-06783-6.
Jacobson, Mark Z. 2008. “On the Causal Link between Carbon Dioxide and Air Pollution Mortality.” Geophysical Research Letters 35 (3). https://doi.org/10.1029/2007GL031101.