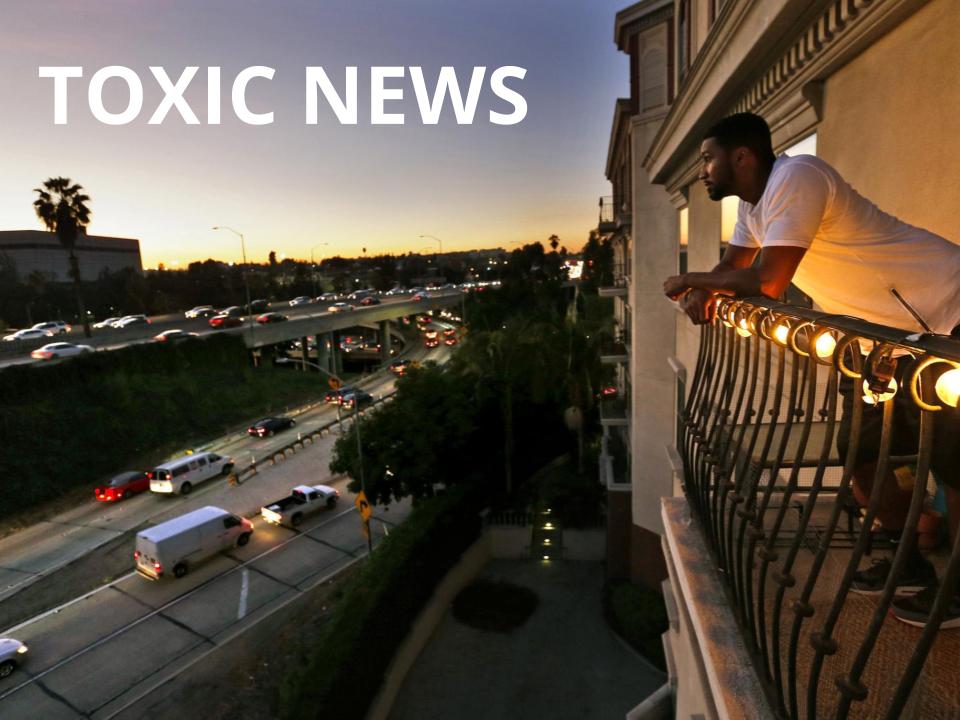
I’m interested in the abilities and constraints of “seeing” toxicity facilitated by public media, drawing on my training in communication, media studies, and STS. For this project, I will focus on air pollution and how it is visualized by public (online) media, such as newspapers, and their data visualization teams. The visualizations are interesting because they address a dispersed public. Further, the figures allow closer scrutiny of their production, e.g. which data they rely on and what kind of reading capacity they facilitate. Limits might be found in the structural absence of data, their contested preservation, and inadequate interpretive capacities. Images can be maps, graphs, and illustrations published by the newspaper, but also adaptations or remixes created on social media. Lastly, they can allow for juxtaposition with images already archived in the Asthma Files.
Description

