
Image
Source
https://www.sciencedirect.com/science/article/pii/0021979772901531?via%3Dihub
Language
English
Contributor(s)
Group Audience
English
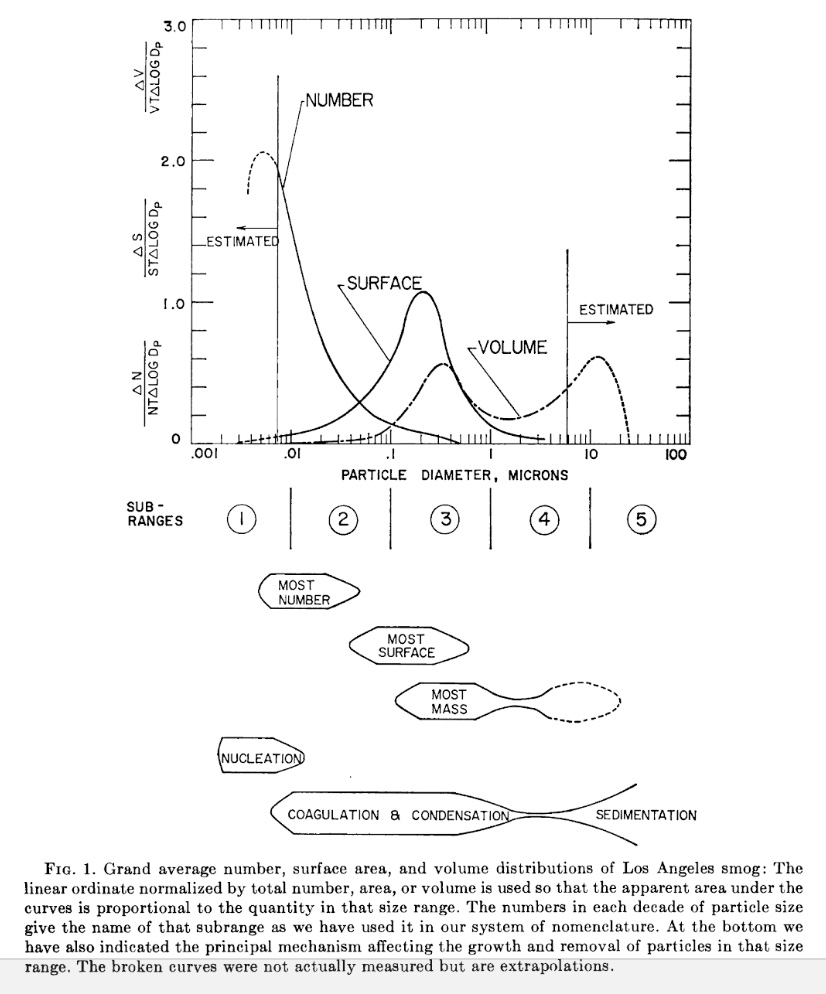
Caption: This is an early diagram of "smog," produced from the air over Los Angeles in September 1969, the start of the contemporary era of air quality research, a time of increased data collection and new data visualizations. I want to emphasize the collective work and scientific attention required to turn imprecise, hazy "smog" -- a recognizable and rapidly worsening civic problem in places like Los Angeles in 1969 -- into something with measurable properties that can be known in fine-grained detail (literally), and thus acted on -- as in, say, the 1970 Clean Air Act.
This graph comes from one of many scientific articles produced by a collaborative group of white men in white shirts and skinny black ties, some of whom worked mostly in Minnesota where they had developed the Minnesota Aerosol Analyzing System, developed for use in occupational health contexts such as granaries and bakeries. At the center of this group is Kenneth Whitby, a guy you probably never heard of unless you've been awarded, or know someone who's been awarded, the Kenneth T. Whitby Award from the American Association for Aerosol Research. Whitby for me is an icon of all the undistinguished scientists and engineers who, in the last 50 years, have worked in the largely unrecognized labor of improving and inventing new scientific instrumentation for collecting air quality data, analyzing air's components in the specificities of time and place, and visualizing the data in new ways to more precisely characterize the slew of particles and toxins smogged there.
Design statement: This exemplifies what Hans-Joerg Rheinberger calls (in terms taken up from Derrida) the “graphematic space” that scientists work in, making (writing) “epistemic objects” such as PM2.5. An indistinct toxic “smog” is graphed/written as an epistemic object --something that is knowable and “graspable” as it comes to have fairly precisely specifiable characteristics (size, surface area, etc.), that get defined in response to the technical parameters and capacities of an experimental systems (instrumentation). definable properties.