
Image
Source
https://coastal.climatecentral.org/map/10/80.2301/12.9188/?theme=sea_level_rise&map_type=coastal_dem_comparison&elevation_model=coastal_dem&forecast_year=2050&pathway=rcp45&percentile=p50&return_level=return_level_1&slr_model=kopp_2014
Language
English
English
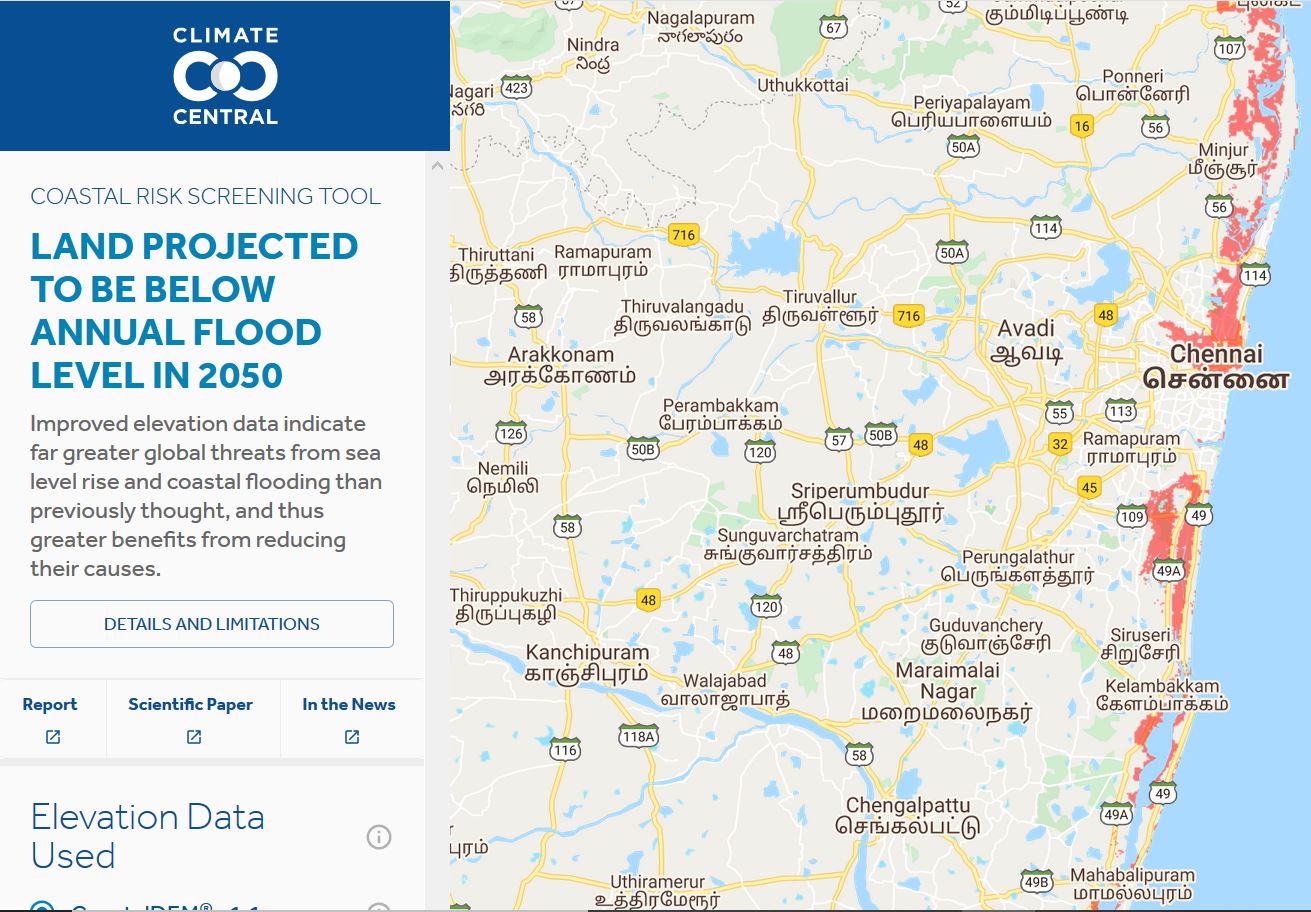
This image shows an interactive map of Chennai which can be used by residents to see the levels of flood risk that their neighborhood is facing. It is being used by environmental activists to create discourse around climate change in Chennai. It is created through Climate Central.